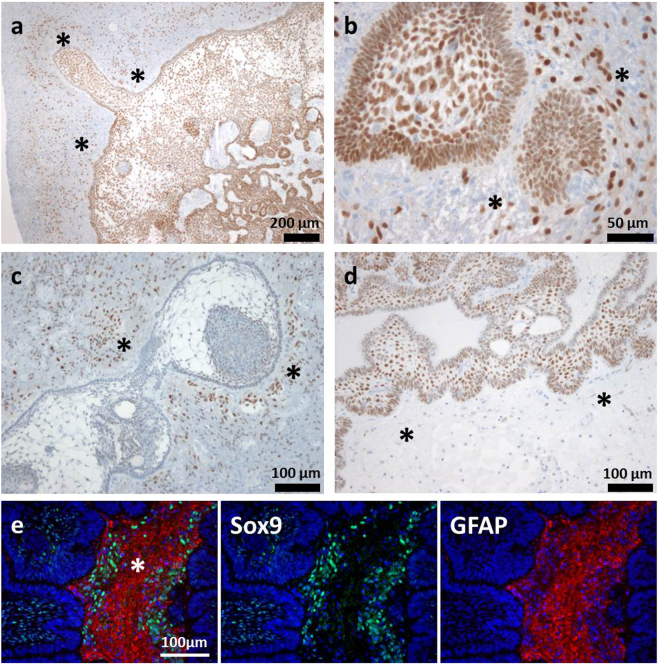
Figure 3.
Varying Amounts of Sox9 Expression in aCP and Surrounding Brain Tissue. (a,b) Some cases showed a higher level of nuclear Sox9 expression in both tumour and surrounding brain tissue indicated by an asterisk [a = ada56 (TIS 12, BT 3), b = ada49 (TIS 12, BT 3)], whereas others (c,d) were predominantly stained in just one of the two. (c) ada28: Low Sox9 expression within the tumour tissue (TIS 3), distinct expression in the surrounding brain (BT 3). (d) ada27: High Sox9 expression scores within the tumour (TIS 12) and only occasional nuclear staining within the surrounding brain tissue (BT 1). (e) Merged double immunofluorescence staining of ada48 underscored enhanced levels of Sox9+ cells (green) within the tumour adjoining GFAP+ (red) brain tissue (asterisk). TIS = total immunostaining score, BT = staining score within tumour surrounding brain tissue.

