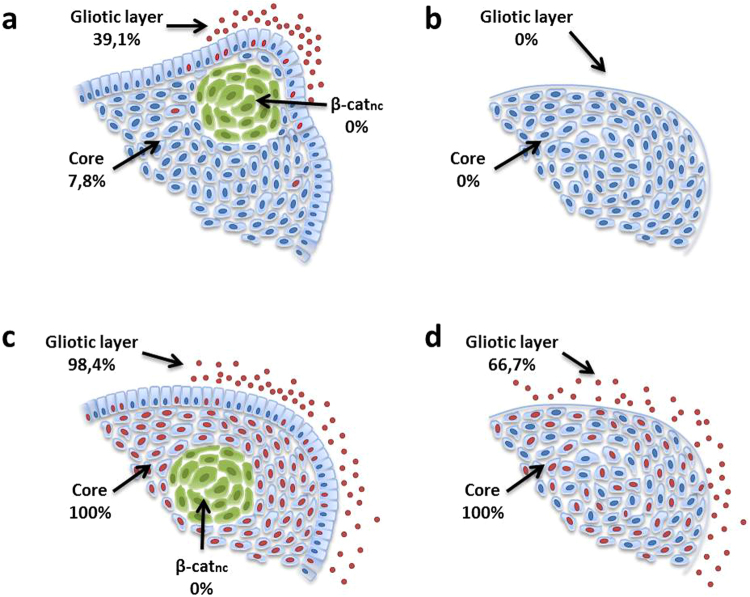
Figure 6.
Percentage shares of Sox2 and Sox9 expression in aCP and pCP. Sox2 expressing cells could be detected in only 7.8% of aCP and in 39.1% of the respective surrounding gliotic layer (a). In the latter Sox2+ cells appeared especially surrounding finger-like tumour protrusions (a). pCP specimen appeared always negative (b). Sox9 could be found in all tumour samples with showing a significantly stronger staining pattern in the core of aCP (c) compared to pCP (d) (p < 0.0001). This was also true for the gliotic layer where 98.4% of aCP and 66.7% of pCP showed Sox9+ cells. Nuclear β-catenin accumulating cell clusters (green: β-catnc), exclusively found in aCP always remained negative both for Sox2 and for Sox9.

