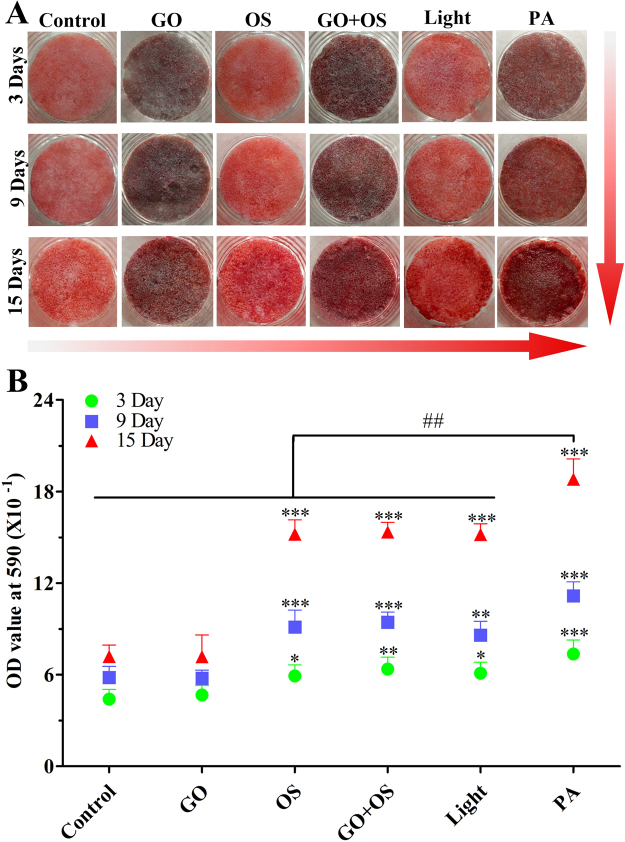
Figure 4.
Alizarin red staining and its quantitative measurement further support that the osteogenic differentiation of BMSCs is enhanced by PA treatment. (A) The Alizarin red staining show calcium deposition in each experimental group (Control, GO, OS, GO + OS, Light, PA). (B) The mineralization of BMSCs were quantified by measuring the absorbance at 590 nm wavelength at 3, 9 and 15 days. All quantitative data were presented as mean ± SD, n = 4; *represents statistical difference as compared with Control group; #represents statistical difference as compared with PA group at 15 days. *P < 0.05, **P < 0.01, ***P < 0.001; ## P < 0.01 from One-way ANOVA with Student–Newman-Keuls post hoc test.

