
Figure 4.
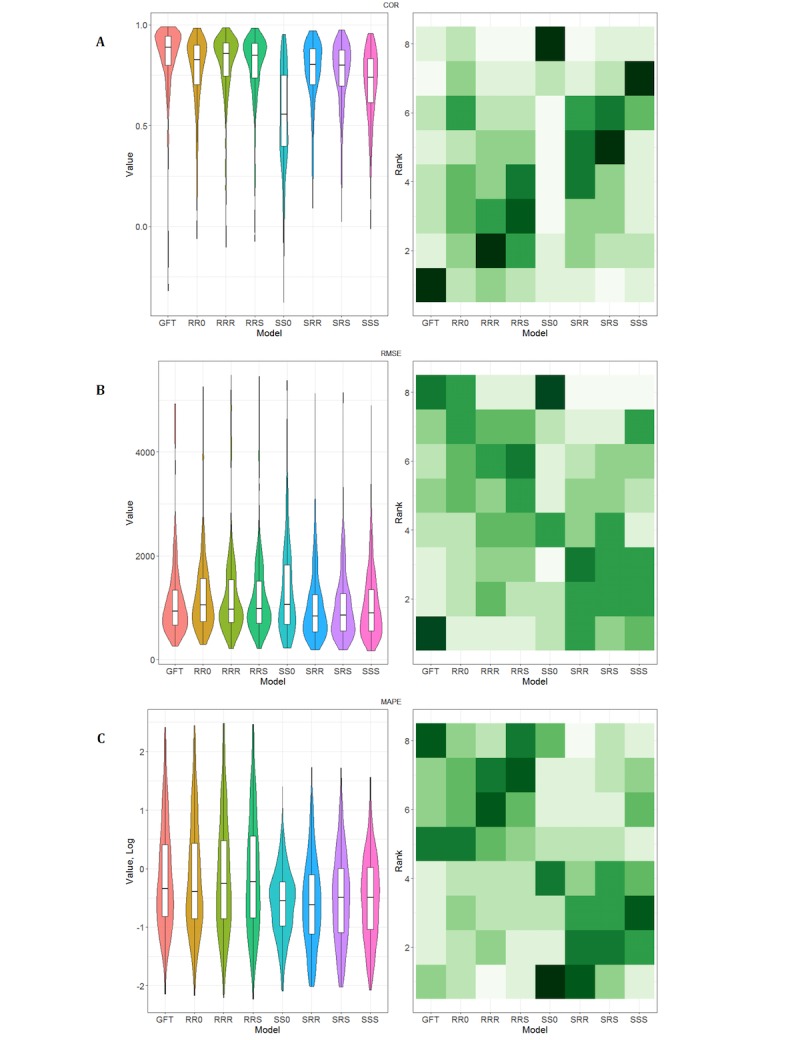
Measures observed with the different model forms A: Pearson correlation coefficient (COR); B: Root mean square error (RMSE); and C: Mean absolute percentage error (MAPE). Left: The box and whiskers show the median, interquartile range (IQR), and extrema (1.5×IQR) for each model form. The colored regions are violin plots showing probability density. Right: Heat map of the distribution of relative ranks of the models; more frequent ranks are darker.