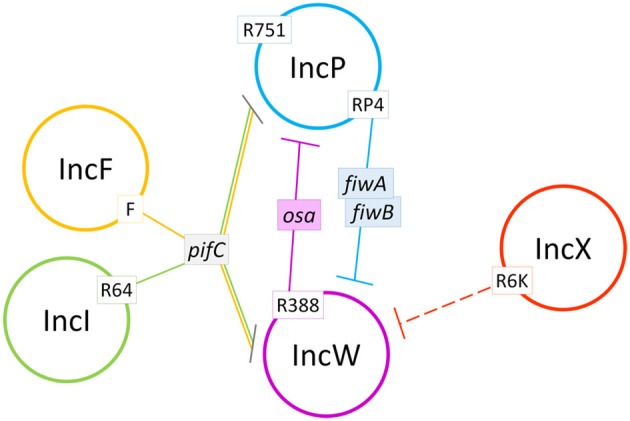
Figure 6.

Schematic summary of the plasmid interactions observed in this study. Plasmid incompatibility groups are represented by colored circles. Continuous lines show identified fertility inhibition systems from plasmids in white boxes. Dashed lines show fertility inhibition systems caused by unidentified genes from plasmids in white boxes.
