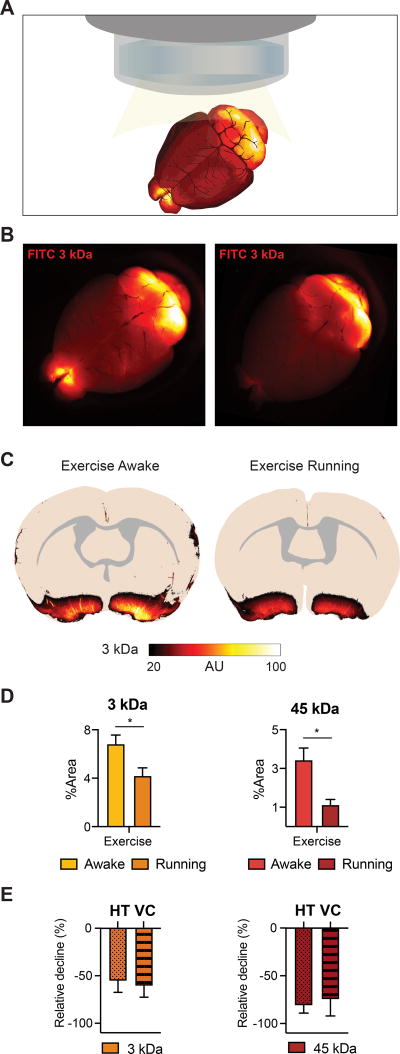
Figure 2. Active running reduces CSF tracer influx.
A. Schematic representing the dorsal macroscopic view of the whole brain after CM injection. B. Macroscopic image of the FITC (3 kDa) tracer distribution in the exercise awake and exercise running groups. C. Overlay of fluorescence influx in coronal sections (bregma −0.3 mm) for exercise awake and exercise running mice (n=3–4). D. The tracer intensity (FITC, 3 kDa and AF647, 45 kDa) as percentage coverage averaged over 7 coronal sections for the exercise running group (n=4) compared to awake exercised mice (n=3). (Student’s ttest, * = P<0.05). E. Relative difference in regional distribution in hypothalamus (HT) and ventral cortex (VC) for the running exercise group compared to the awake exercise group (normalized values, n=3–4).

