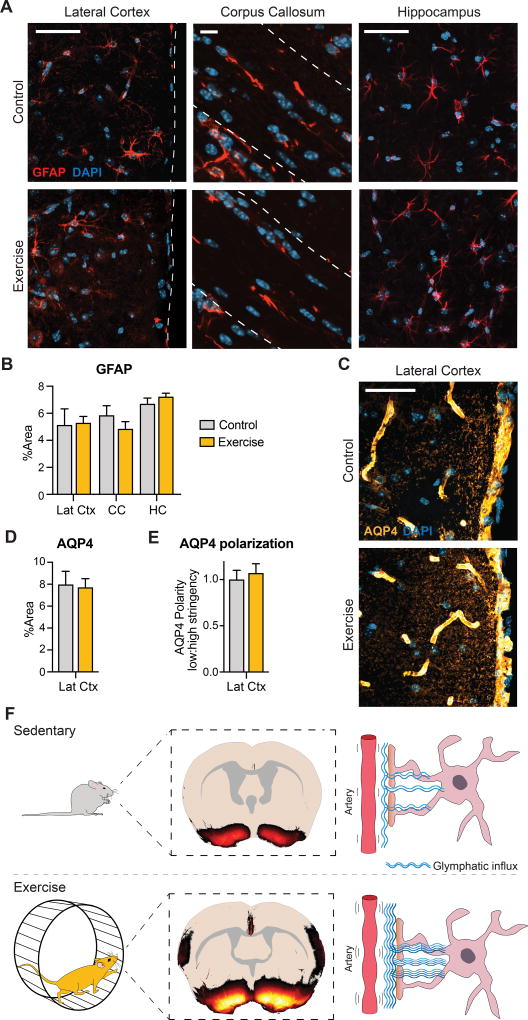
Figure 3. Astrocytic expression of GFAP and AQP4 is unaltered.
A. Confocal images of GFAP expression shown as maximum intensity projection of 10 µm z-stack, 40×. B. Glial fibrillary acidic protein (GFAP) expression in layer 1 of the lateral cortex (Lat Ctx), corpus callosum (CC), and CA3 of the hippocampus (HC) quantified as percentage area coverage (n=6) (Multiple t-testing with FDR, P=0.3–0.9). C. Representative confocal images of aquaporin-4 AQP4 expression (40×). D. AQP4 expression quantified as percentage area coverage in layer 1 of the lateral cortex (n=6) (Student’s t-test, P=0.8). E. AQP4 polarization calculated as low to high stringency as previously described [31]. Data are normalized. No significant difference (n=6) (Student’s t-test, P = 0.6). F. Our proposed model of glymphatic activity following five weeks of voluntary wheel running. When CSF tracers are injected into the cisterna magna of exercised awake animals, the glymphatic influx is increased compared to sedentary control mice.

