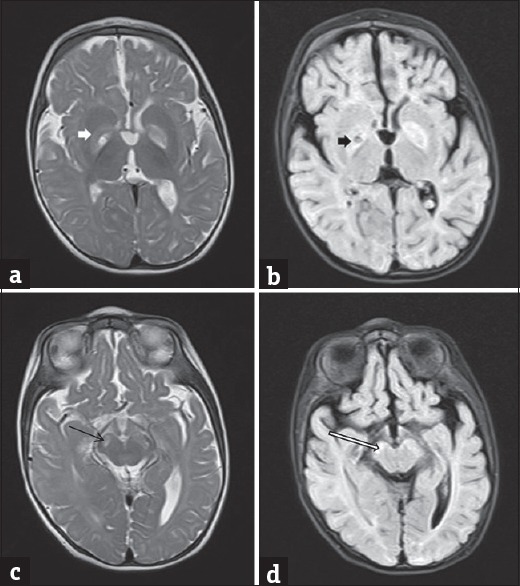
Figure 1.

Axial T2 (a and c) and fluid attenuation inversion recovery (b and d) magnetic resonance images showing hyperintensity in the globus pallidus (white arrow in a and black arrow in b) and substantia nigra (black arrow in c and white arrow in d)
