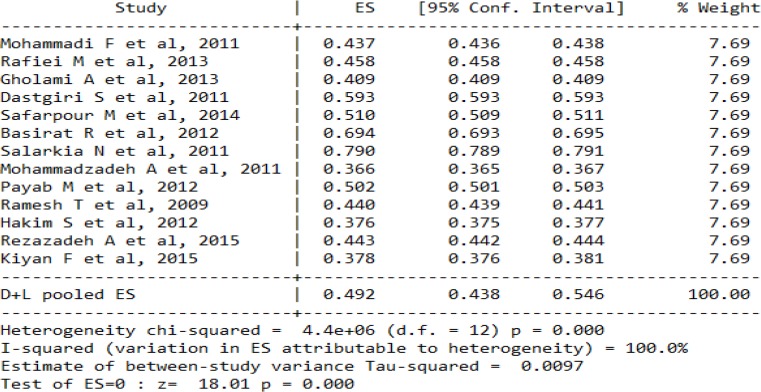
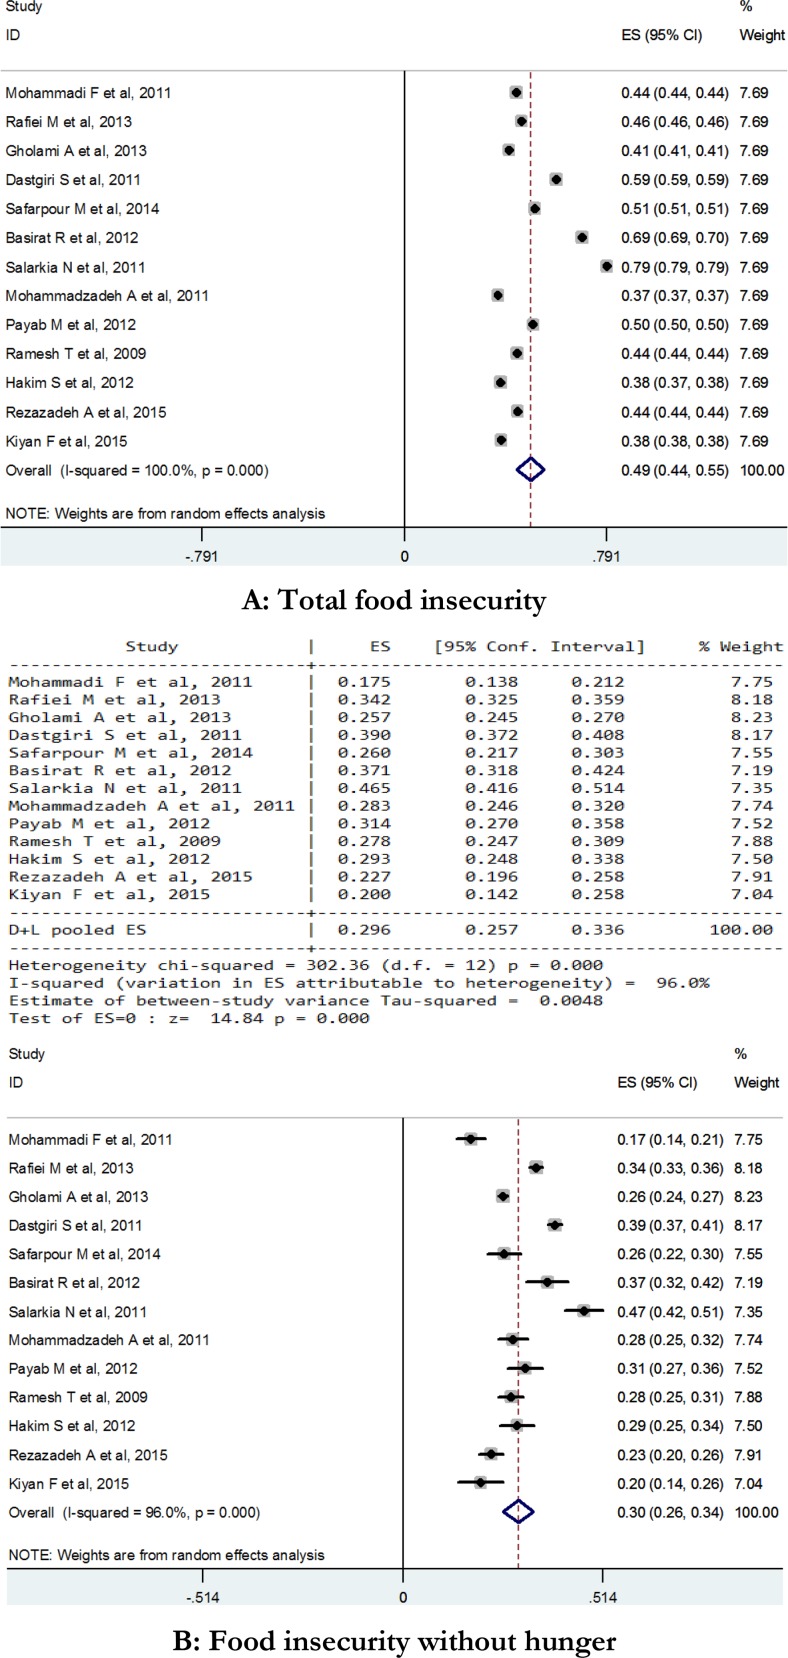
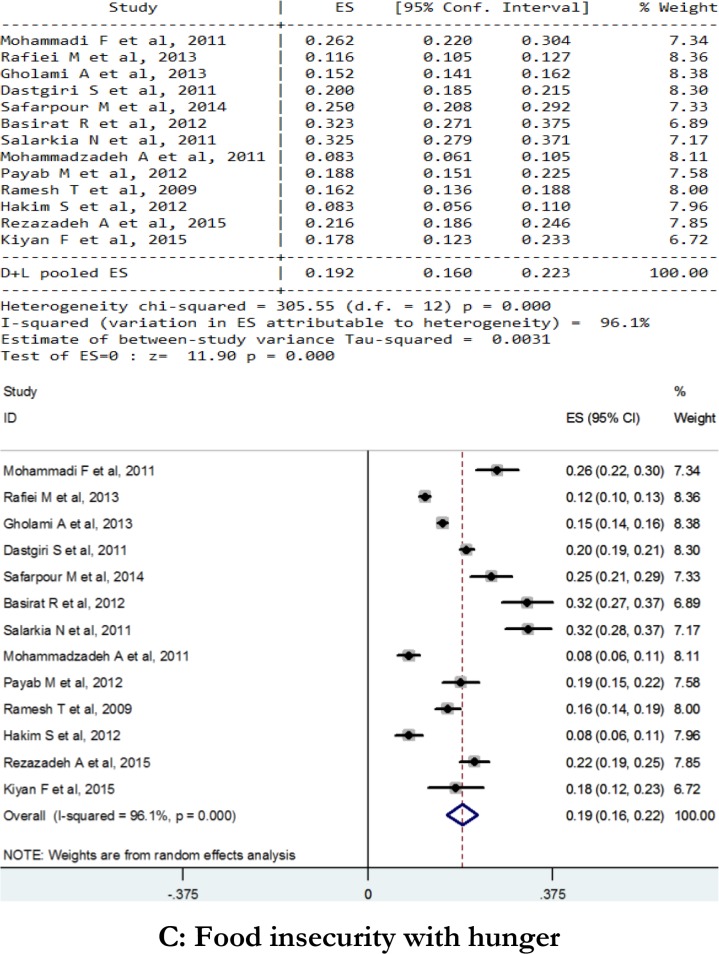
Fig. 2:
Forest plot of random effect model of mata-analysis for prevalence of food insecurity in Iran. Squares represented effect estimate of studies with their 95% confidence intervals with size of squares proportional to the weight assigned to the study in the meta-analysis. The diamond represents the overall results and 95% confidence interval of the random effect of the meta-analysis. A: Total food insecurity, B: Food insecurity without hunger, C: Food insecurity with hunger


