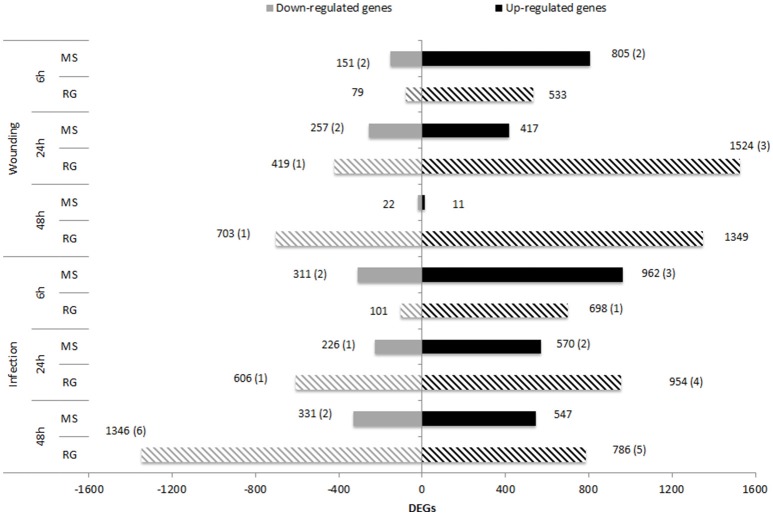
Figure 2.
Number of up– and down–regulated genes [FDR p ≤ 0.01 and log2(ratio)≤-1 or log2(ratio)≥1] in MS (solid bars) and RG (striped bars) parental lines at 6, 24, and 48 h after wounding or after P. expansum inoculation compared to non–treated apples (Time 0). Numbers between parentheses indicate the number of DEGs located within the qM–Pe3.1 QTL on LG3.

