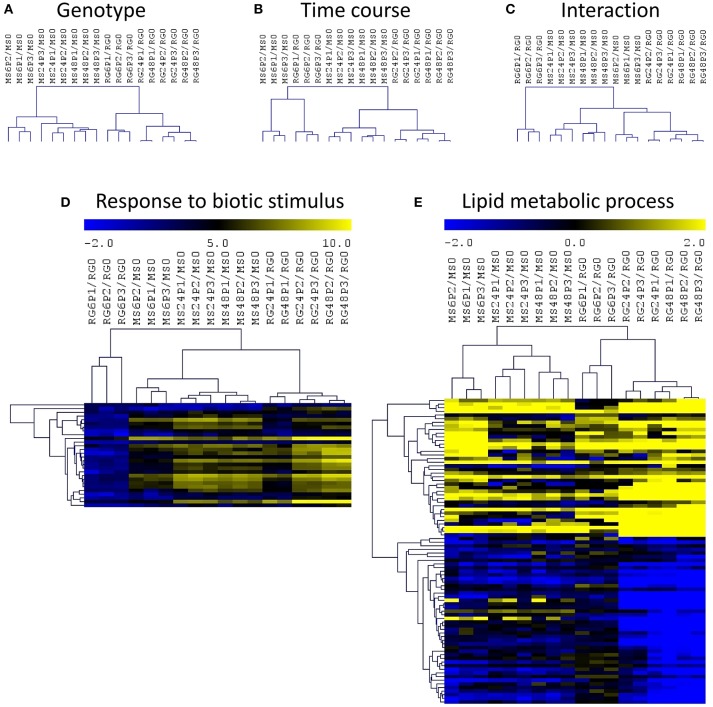
Figure 4.
Hierarchical cluster (HCL) analysis and heatmaps of differentially expressed genes (two–factor ANOVA) based on genotype (A), time course of P. expansum infection (B), and the interaction (C). Heatmap of genes included in the significant biological processes “response to biotic stimulus” (D) and “lipid metabolic process (E) based on the list of DEGs during the time course (D) or the interaction (E). Abbreviations: Malus sieversii–PI613981 resistant apple (MS) and Malus x domestica “Royal Gala” susceptible apple (RG) at time 0 and inoculated with Penicillium expansum (P) at 6, 24, and 48 hpi. Data are expressed as log2(ratios).

