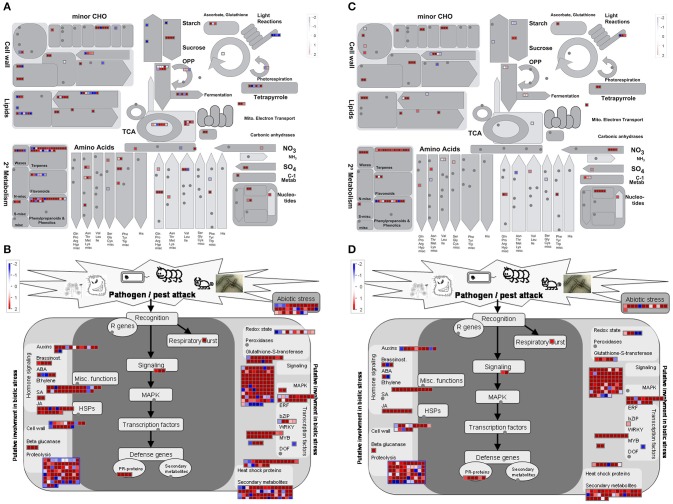
Figure 5.
Overview of metabolic pathways (A,C) and of genes related to biotic stress (B,D) for each DEGs upon P. expansum infection after 6 hpi in the resistant MS parent (A,B) or in the susceptible RG parent (B,D) vs. Time 0. The scale bar displays changes in gene expression as log2 (ratio MS6P/MS0) or log2(ratio RG6P/RG0) that were significant (FDR p value≤0.01). Genes induced due to the P. expansum infection are highlighted in red and repressed genes are highlighted in blue. CHO, carbohydrates; OPP, oxidative pentose phosphate; TCA: tricarboxylic acid cycle.

