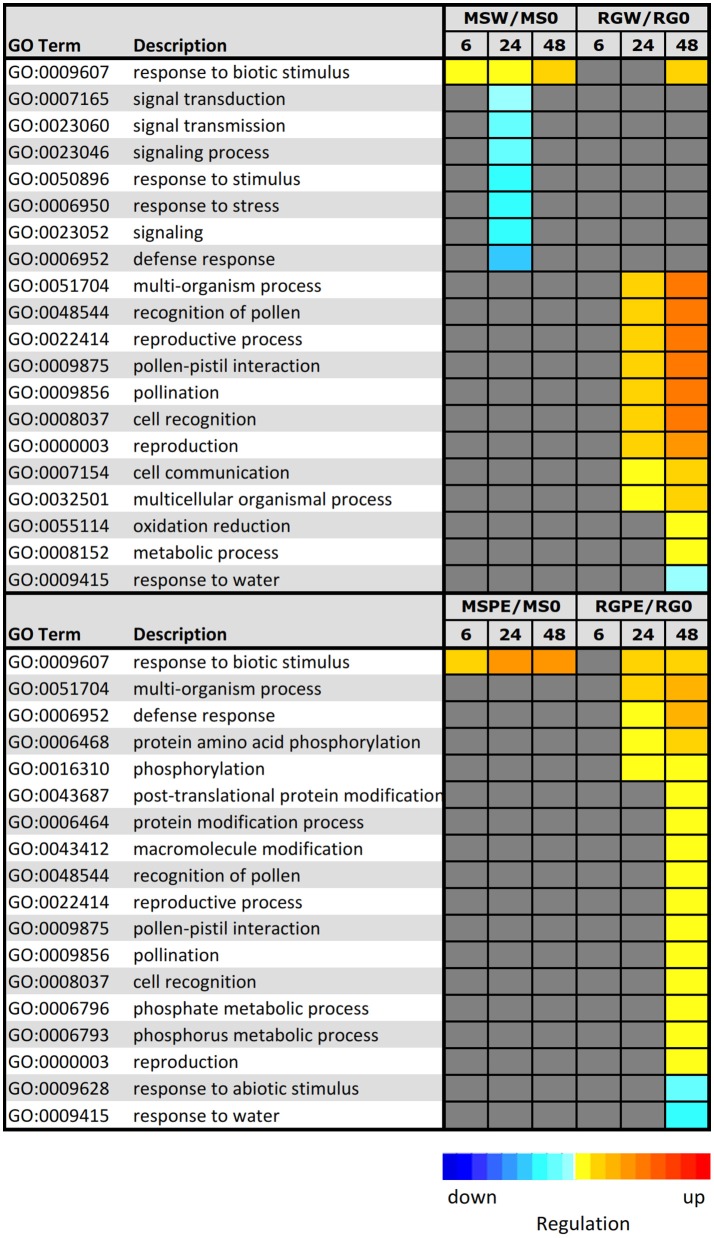
Figure 6.
Parametric analysis of gene–set enrichment (PAGE) using AgriGo to identify enriched GO terms onto the biological term inclusive of gene expression levels. The colored blocks represent the level of up/downregulation of each term at a certain time–point. The yellow–to–red, cyan–to–blue, and grayscale represent the term is upregulated, downregulated, or no–significant change, respectively. The adjusted p-value of the term determines the degree of color saturation of the corresponding box. MSW/MS0 = comparison of M. sieversii at 6, 12, and 48 h after wounding, relative to Time 0. RGW/RG0 = comparison of “Royal Gala” at 6, 12, and 48 h after wounding, relative to Time 0. MSPE/MS0 = comparison of M. sieversii at 6, 12, and 48 h post-inoculation with P. expansum, relative to Time 0. RGPE/RG0 = comparison of “Royal Gala” at 6, 12, and 48 h post–inoculation with P. expansum, relative to Time 0.

