
Fig. 7.
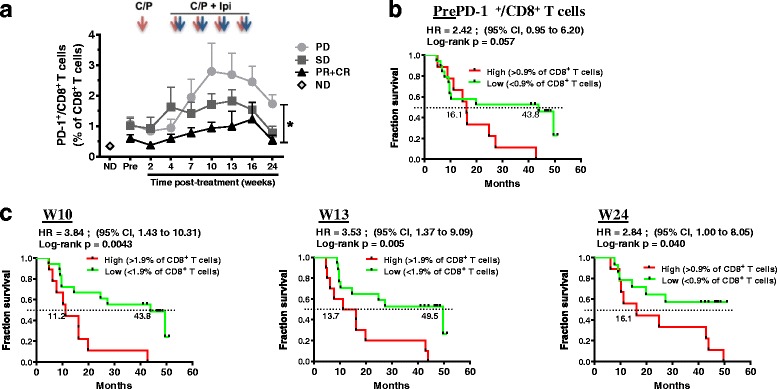
Monitoring of circulating CD8+PD-1+ levels and impact on OS. a Circulating CD8+PD-1+ T cell levels before and during treatment. Effect of response groups and time points and their interaction were assessed with a one-way ANOVA group comparison using a linear mixed effects models for repeated measures; *: p < 0.05 between irPD and irPR + CR groups. b-c Kaplan-Meier OS curves for the CD8+PD-1+ T cell population, stratified by mean percentages at baseline (b, Pre) and each indicated time point (c). P values were calculated using the log-rank test and are shown on each graph