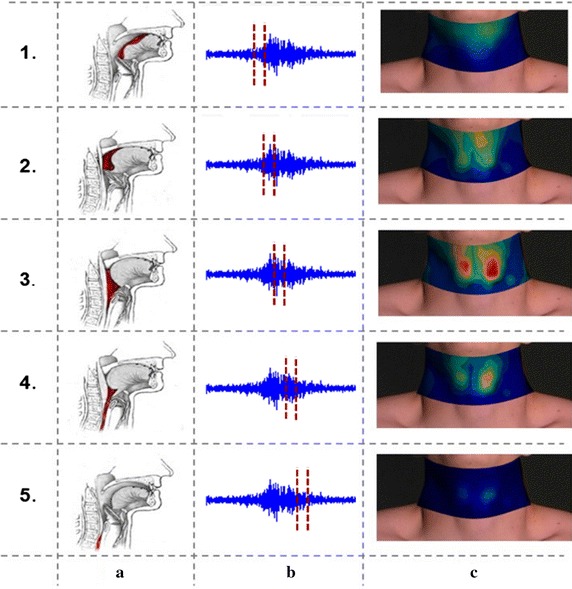
Fig. 5.

a Five physiological phases of the swallowing process; b sEMG signal and the time interval of each phase; c averaged sEMG energy maps of each phase when swallowing 5 ml of water

a Five physiological phases of the swallowing process; b sEMG signal and the time interval of each phase; c averaged sEMG energy maps of each phase when swallowing 5 ml of water