Fig 1.
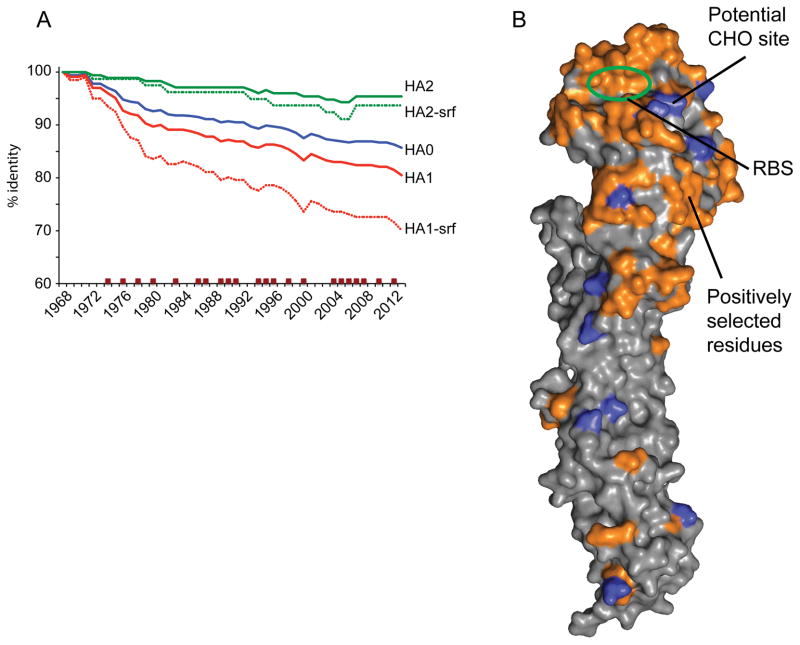
A) To analyze HA evolution with time the HA sequences for A(H3N2) viruses were grouped according to year and consensus sequences were generated. Datasets corresponding to the HA0, HA1, HA2, as well as only surface residues (HA1-srf and HA2-srf) were also generated for comparison. Data was plotted as percentage change in identity to the 1968 consensus. Years where the H3 component of the Northern hemisphere vaccine was changed are marked with brown squares. B) Surface representation of the Victoria11 HA monomer highlighting surface residues (orange) that have undergone substitution and that were maintained in subsequent years. All structural figures were generated with MacPyMol (Delano, 2002).

