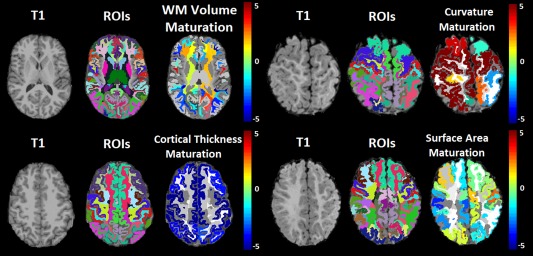
Figure 2.

Structural MRI examinations (labeled T1) of 18‐year‐old (left half) and 11‐month‐old (right half) participants, with FreeSurfer segmentations (labeled ROIs) and color maps assessing maturation relative to age expected values for a variety of subregions in the brain (color maps provided, units are in years to be interpreted as a relative measurement not absolute). Red regions indicate precocious development given participant age and blue regions indicate underdevelopment. [Color figure can be viewed at http://wileyonlinelibrary.com]
