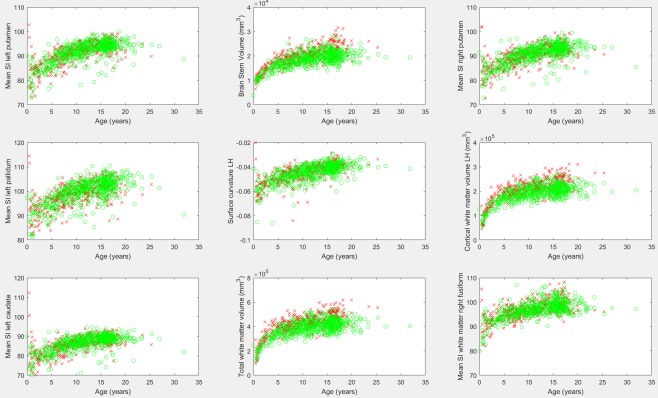
Figure 3.

Biomarker measurements identified as having the highest correlation with participant age. Males are represented by a red “x,” females by a green “o.” SI, signal intensity; LH, left hemisphere. [Color figure can be viewed at http://wileyonlinelibrary.com]
