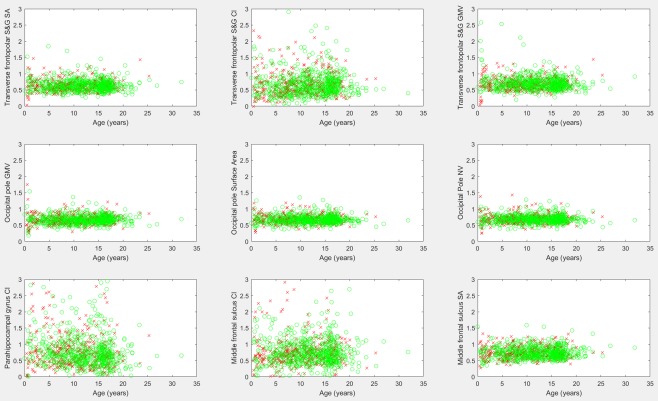
Figure 5.

Scatter plots of biomarkers exhibiting strong rightward asymmetries. Males are marked with a red “x,” females with a green “o.” Asymmetry scores (y axes) were acquired by dividing the left hemisphere's biomarker by the corresponding right hemisphere biomarker. Values below 1 indicate a rightward asymmetry. CI, curvature index; S&G, sulcus and gyrus; SA, surface area; GMV, gray matter volume; NV, number of vertices. [Color figure can be viewed at http://wileyonlinelibrary.com]
