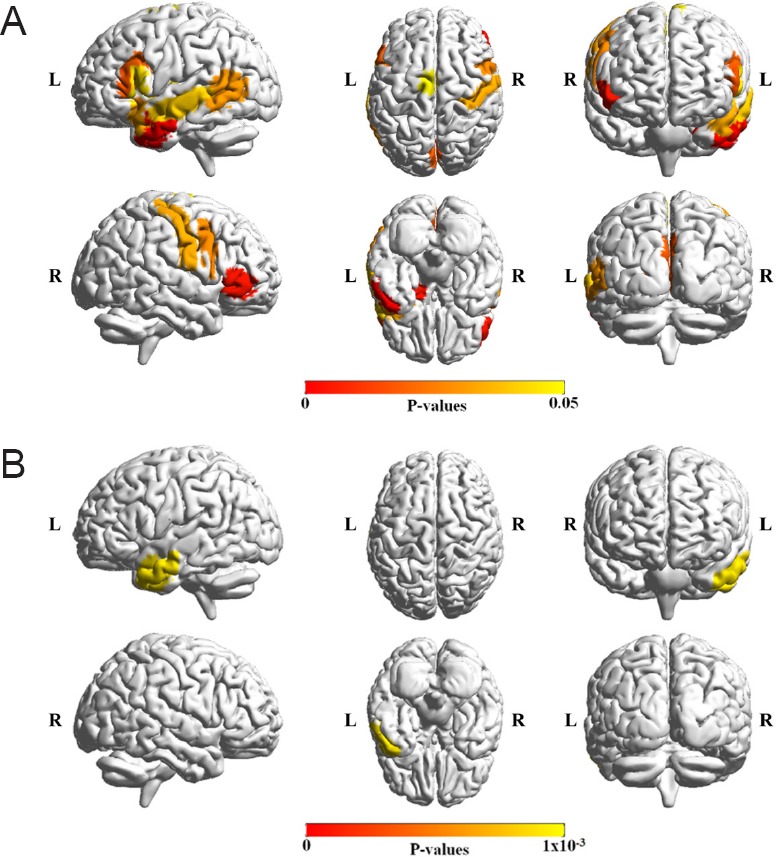
Figure 2.

Brain regions that showed a significant age-by-status interaction by the two-way analysis of variance (ANOVA) test using degree centrality (DC).
The P values from analysis of variance (ANOVA) are visualized using the color bar (from red to yellow) in the middle of the plot. (A) The left superior frontal gyrus, left inferior frontal gyrus, right inferior frontal gyrus, right precentral gyrus, left superior temporal gyrus, left middle temporal gyrus, right postcentral gyrus, left insular gyrus, left medioventral occipital cortex, right medioventral occipital cortex, left amygdala, and left basal ganglia showed a significant effect of interaction (P < 0.05). (B) The left middle temporal gyrus region showed a significant effect of interaction (P < 0.001). The ADHD and TD groups showed different patterns based on age as inferred by the two-way ANOVA. ADHD: Attention deficit and hyperactivity disorder; TD: typically developing; L: left: R: right.
