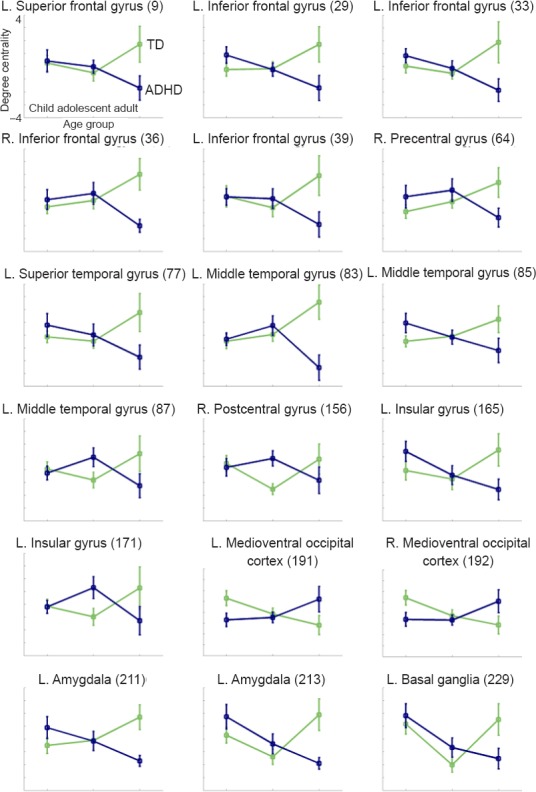
Figure 3.

Age-related degree centrality patterns of the identified regions.
The mean and standard error of degree centrality for brain regions that showed significant age-by-status interactions for each age group from Table 2 (P < 0.05). The green plot denotes the mean degree centrality values of the TD groups and the blue plot denotes the mean degree centrality values of the ADHD groups. L.: Left: R.: right; TD: typically developing; ADHD: attention deficit and hyperactivity disorder.
