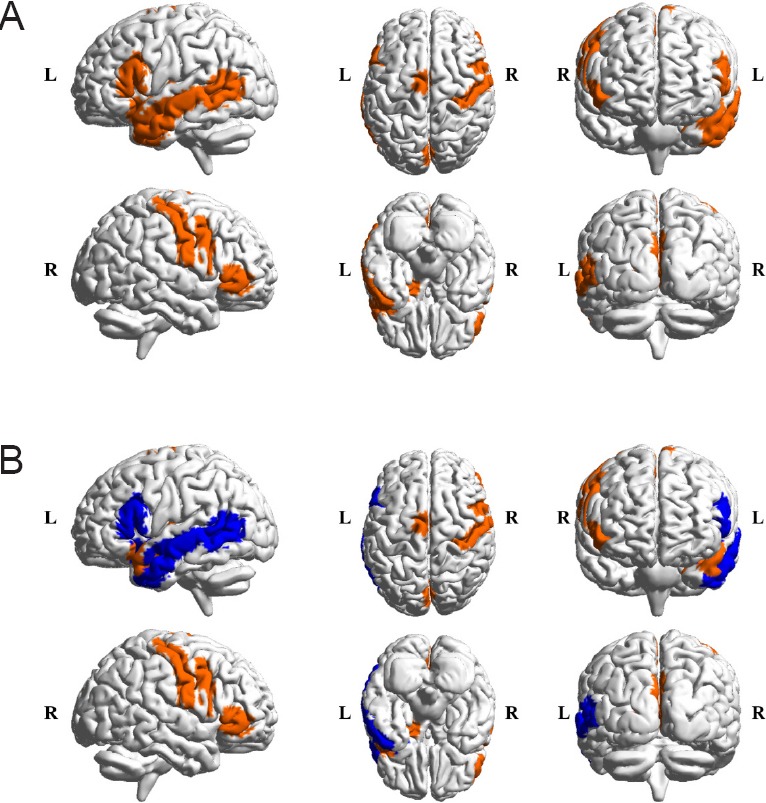
Figure 4.

Comparison between identified regions and known regions related to cognitive functions.
(A) Regions (orange mask) that showed a significant age-by-status interaction by the two-way analysis of variance (ANOVA). (B) Regions (blue mask) related to cognitive function from previous studies (Vandenberghe et al., 1996; Goel and Dolan, 2001; Swick et al., 2008; Fan et al., 2016). L: Left; R: right.
