
Figure 2.
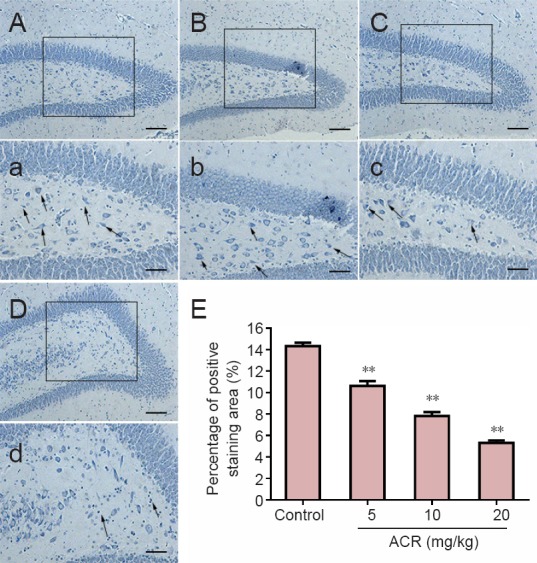
Nissl staining of hippocampal neurons of postnatal day 21 weaning rats.
(A–D) Nissl staining of control and acrylamide (ACR) 5, 10 and 20 mg/kg groups. Scale bars: 100 μm. (a–d) Higher magnification for boxes in A–D. Scale bars: 10 μm. The number of Nissl bodies decreased with increasing ACR concentration. (E) Percentage of positively stained area (%) in each field. **P < 0.01, vs. control group (mean ± SD, n = 8, one-way analysis of variance followed by Tukey post hoc test).