Fig. 1.

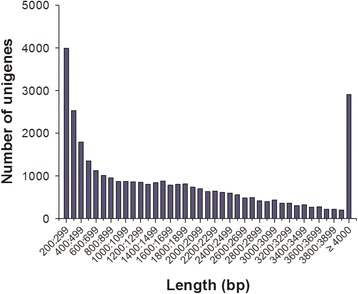
Transcriptome sequence length distributions of S. marmoratus unigenes. The x-axis indicates unigene size and the y-axis indicates the number of unigenes with different lengths

Transcriptome sequence length distributions of S. marmoratus unigenes. The x-axis indicates unigene size and the y-axis indicates the number of unigenes with different lengths