
Fig. 5.
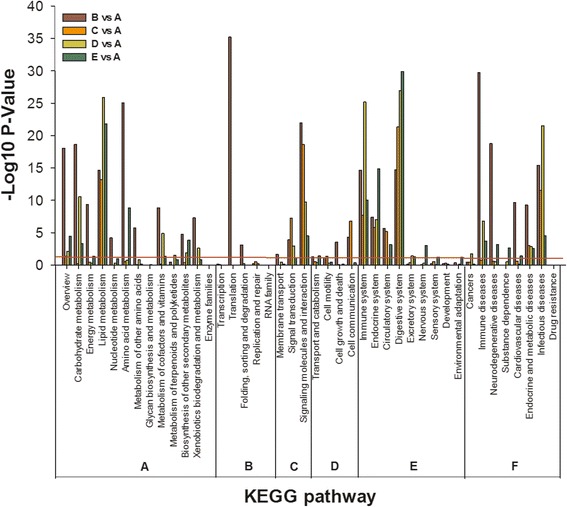
KEGG pathway enrichment analysis of the differently expressed genes between C. irritans-infected (B, C, D, E) and non-infected (A) S. marmoratus. The red line represents P = 0.05. Key: A, Metabolism; B, Genetic Information Processing; C, Environmental Information Processing; D, Cellular Processes; E, Organismal Systems; F, Human Diseases