
Fig. 8.
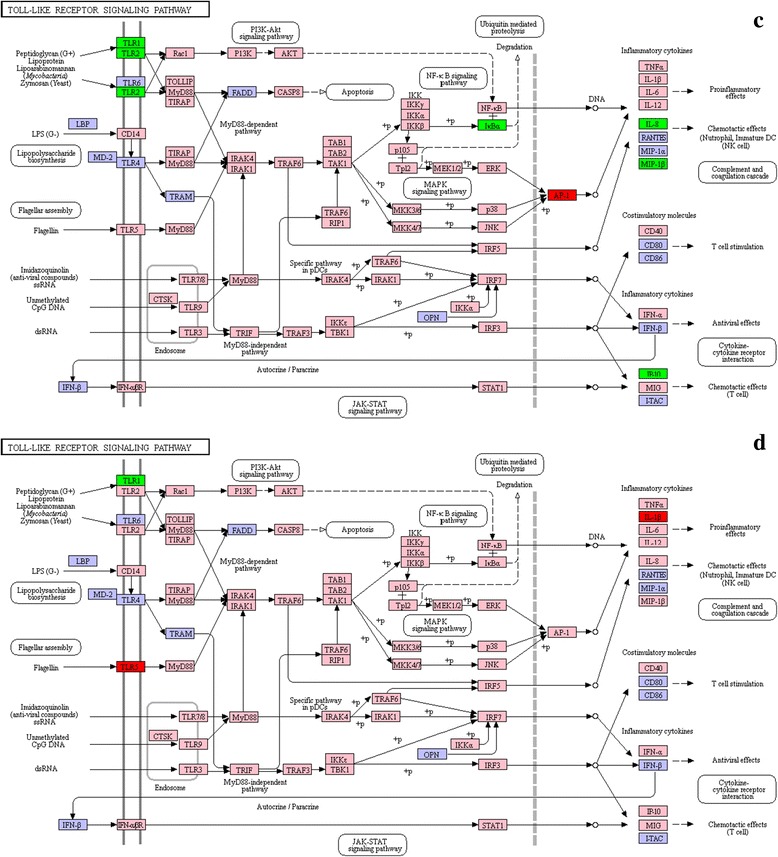
List of genes involved in Toll-like receptor pathway generated by KEGG of the differently expressed genes between Cryptocaryon irritans-infected and non-infected S. marmoratus, 72 h (group D) and 96 h (group E) post-challenge and uninfected fish were sampled as control (group A). c group D vs group A; d group E vs group A. Red indicates significantly increased expression; green indicates significantly decreased expression, and pink indicates unchanged expression. Blue denotes genes that were not identified in the expression profile analysis