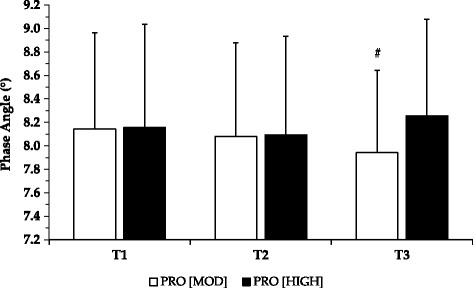
Fig. 3.

Pre-exercise phase angle assessment across testing days (T1-T3) for both dietary interventions. Figure shows the mean phase angle for both dietary interventions assessed pre-exercise across testing days. Phase angle assessed by bioelectrical impedance. All data are presented as M ± SD. # Significantly different between PROMOD and PROHIGH at T3 only (p = 0.012)
