
Fig. 1.
Example of presentation in PACS.
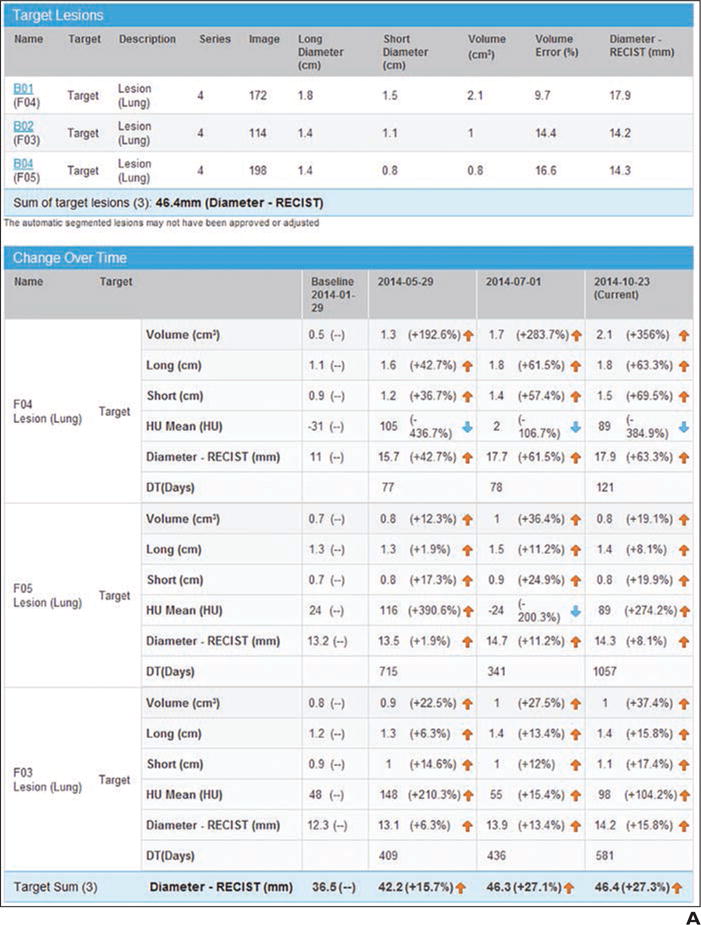
A, Screen shot shows quantitative tumor report generated in PACS. Tumor measurements are automatically exported to report after radiologist obtains measurements.
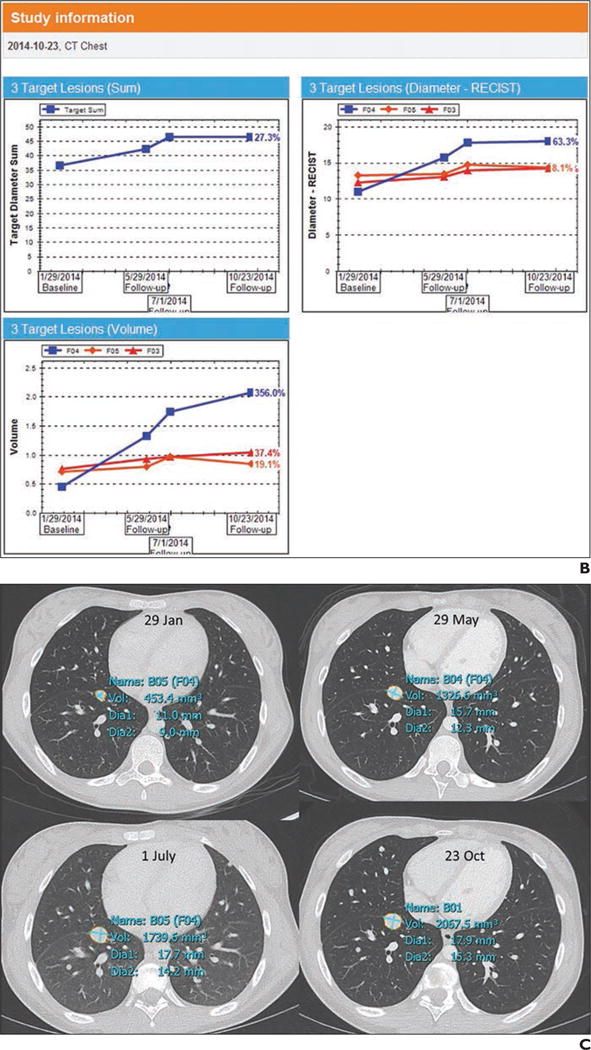
B, Screen shot shows tumor data tabulated and graphs of tumor trajectory (change in tumor size over time). In this example, tumors became larger during one therapy and then stabilized between time points 3 and 4.
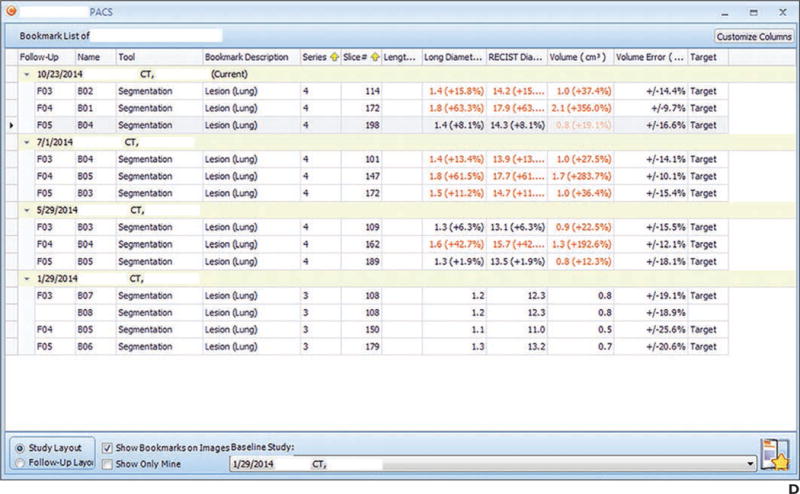
C, Screen shot shows key images saved and their measurement annotations.
D, Screen shot shows bookmark list of measurements and trajectory of each lesion linked to key images.