Figure 1.

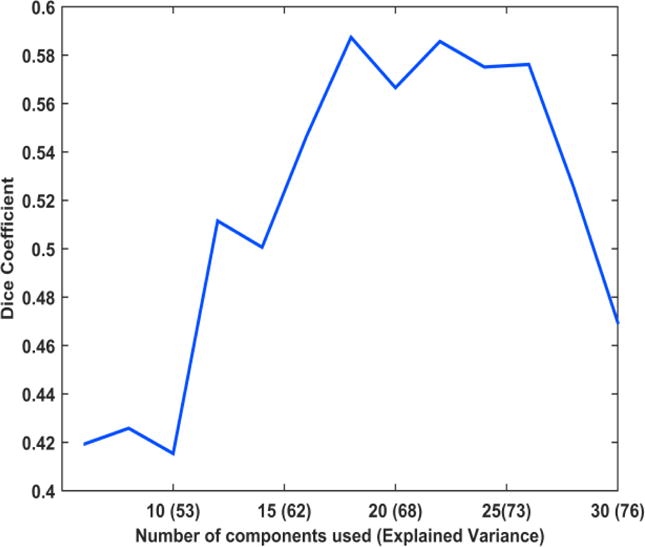
Plot showing the variation in Dice coefficient as the number of principal components (explained variance) is increased. It can be noted that the dice coefficient initially increases, reaches a peak and subsequently decreases.

Plot showing the variation in Dice coefficient as the number of principal components (explained variance) is increased. It can be noted that the dice coefficient initially increases, reaches a peak and subsequently decreases.