
Fig. 5.
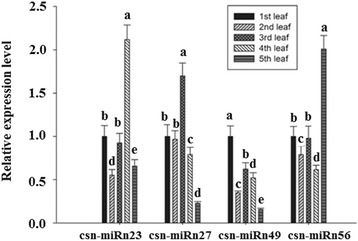
Relative expression levels of four selected novel csn-miRNAs in leaf tissues from different positions in the tender tea shoot. U6 snRNA was used as an internal control. The expression level of the miRNAs in the first leaves was set as 1.0. Relative expression was calculated using the 2-△△CT method with stem-loop qRT-PCR. Data represent the mean ± SD values of three biological replicates. Different letters above the bars represent significant differences at p < 0.05. Means followed by the same letter over the bars are not significantly different at the 0.5% level, according to DMRT analysis