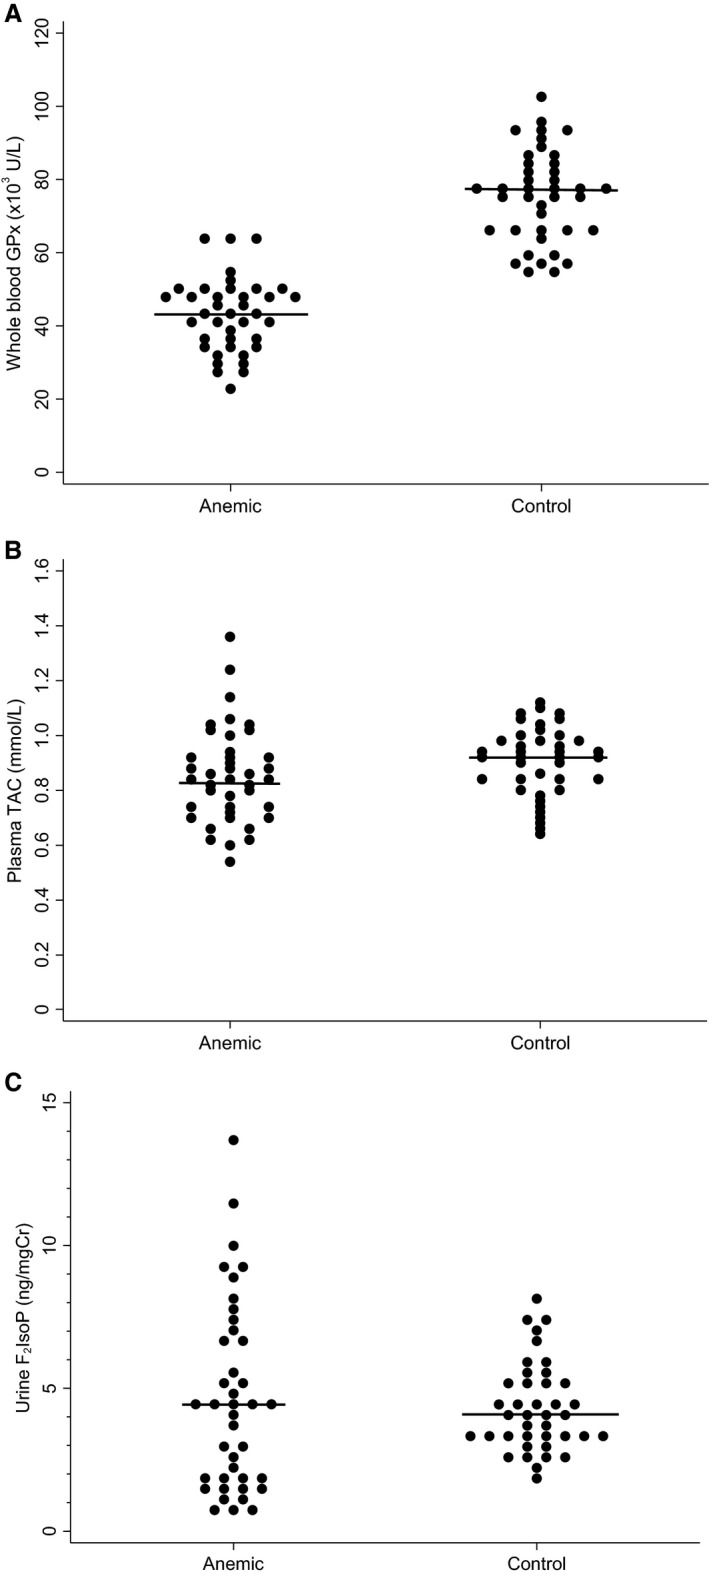
Figure 2.

(A) Whole blood GPx activity in anemic dogs compared to healthy control dogs (P < 0.001). (B) Plasma TAC in anemic dogs compared to healthy control dogs (P = 0.15). (C) Urinary F2IsoP in anemic dogs compared to healthy control dogs (P = 0.73). Horizontal bars represent the median value. GPx, glutathione peroxidase; F2IsoP, 15‐F2‐Isoprostanes; TAC, total antioxidant capacity.
