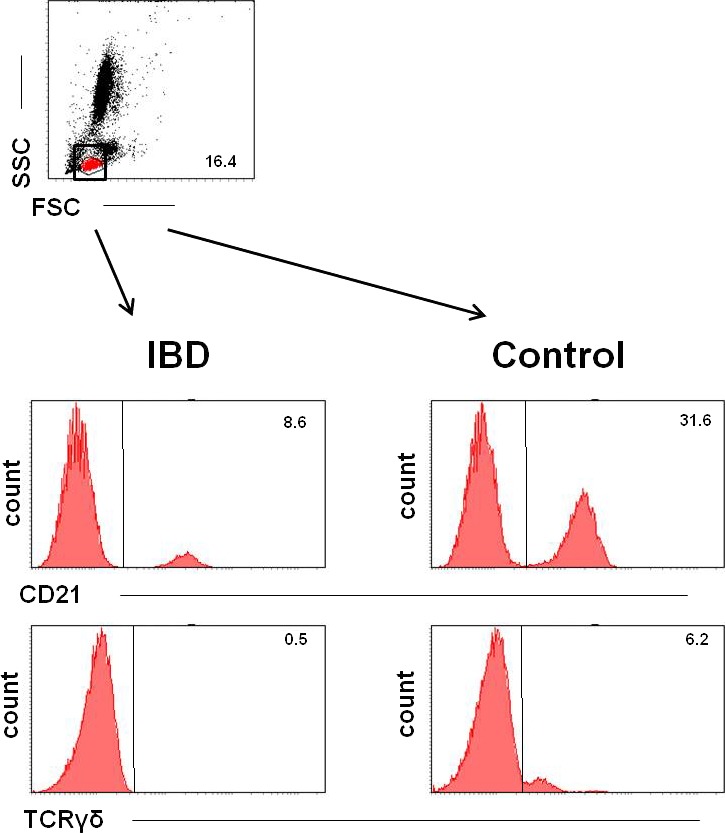
Figure 2.

Representative FCM analyses of PBLs in dogs with IBD (left) and healthy control dogs (right). Data are presented by histograms showing the expressions of 1 parameter per histogram. Top row: Representative dot blot showing the forward/sideward scatter (FSC/SSC) properties of the analyzed PBLs gating the lymphocyte population (red). Rows 2 and 3 show representative histograms of TCRγδ and CD21 expressions with negative cells on the left and positive cells on the right side of the graphs. The percentages of the respective positive populations are indicated by the number in the right upper corner of the graphs, IBD dogs, and healthy control dogs showing significant differences in these subpopulations between groups.
