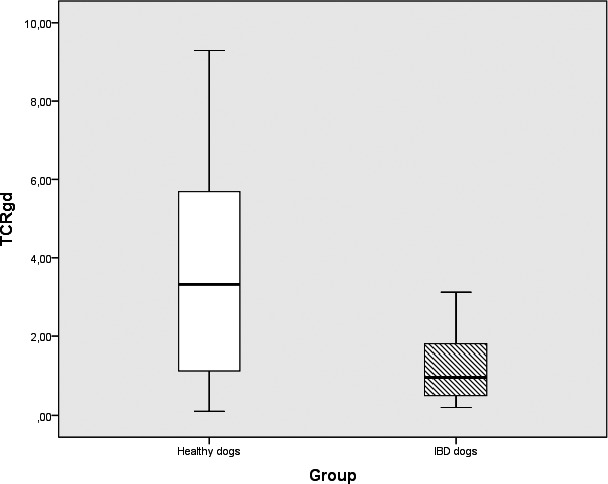
Figure 3.

Box plots comparing percentages of TCRγδ expression in IBD (n = 19) and healthy control dogs (n = 10). PBLs in IBD dogs and healthy control dogs showing significant differences in the subpopulations between groups (P = 0.026). Box plots represent the 25–75th percentile; the median is shown as the heavy dark horizontal line. Vertical lines extend to the minimum and maximum values.
