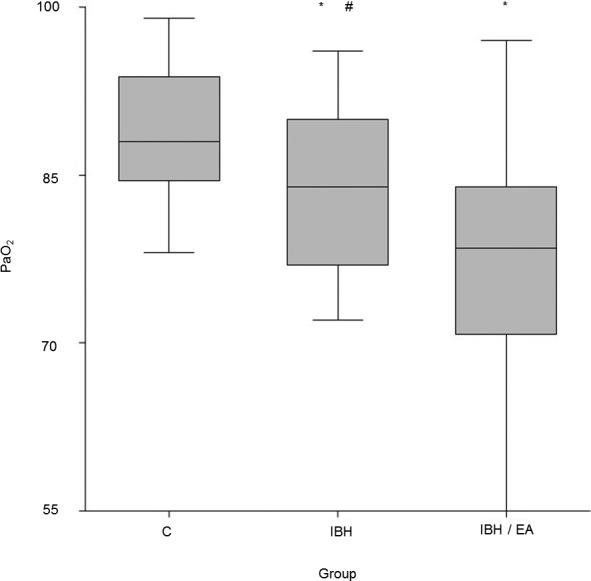
Figure 3.

Box plots revealing the partial pressure of arterial oxygen (PaO2) of healthy horses (C) (n = 22; 89 ± 6 mmHg), horses suffering from insect bite hypersensitivity (IBH) (n = 24, 84 ± 8 mmHg), and horses suffering from both IBH and equine asthma (IBH/EA) (n = 23, 78 ± 11 mmHg). *Indicates a significant difference compared to group C. # indicates a significant difference between group IBH and IBH/EA.
