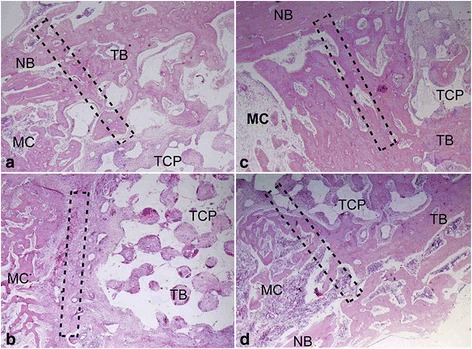
Fig. 6.

Histological evaluation of interfacial area between the implant and the host bone of PRP group constructs (a, c) and non-PRP group constructs (b, d) at 4 weeks (a, b) and 8 weeks (c, d) postoperatively. The newly formed bone grew and merged at interfacial area for both groups with implantation period prolonging. However, the amount and rate of the new bone formation of the non-PRP group was less and slower than that of PRP group (HE staining; × 40. TCP, tricalcium phosphate; TB, tissue-engineered bone; NB, native bone; MC, medullary cavity. The dotted rectangles indicate the interfacial area)
