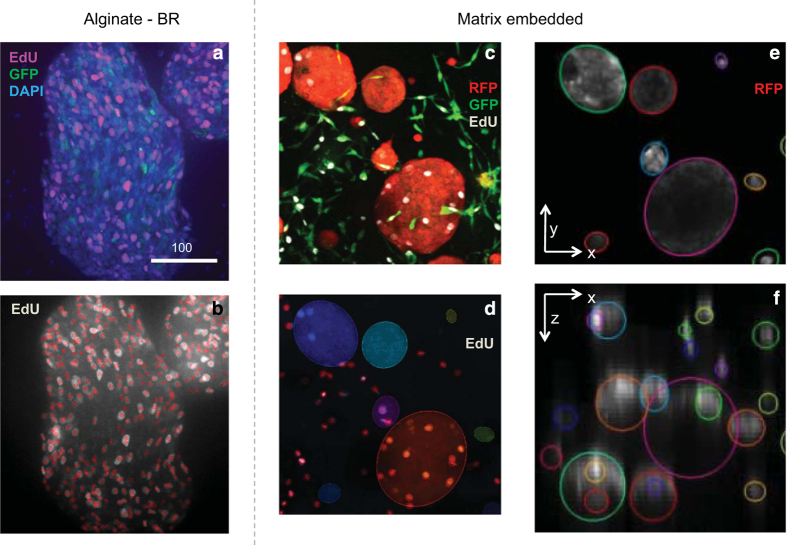
Figure 3. Examples for the image processing workflow.
(a,b) A fluorescent spheroid from an alginate-BR culture with (b) the detection of EdU positive cell illustrated, where red circles indicate positive cells. (c) A small subset of an image-stack of a matrix (Matrigel, DMSO) embedded 3D spheroid culture, where in panel (d) the detection of EdU positive cells is shown as circles within spheroids (red circles outside the spheroid originate from proliferating fibroblasts). The spheroids themselves are approximated by ellipsoids and shown in color. In (e,f) the top and side view of the segmentation contours are shown to illustrate the ellipsoid approximation. Spheroids only visible in (f) but not in (e) are originating from (x,y)-coordinates outside the subset of the xy-plane. RFP (red): Tumor cells; GFP (green): Stromal fibroblasts; DAPI (blue): Nuclei; EdU (pink): Proliferating nuclei.

