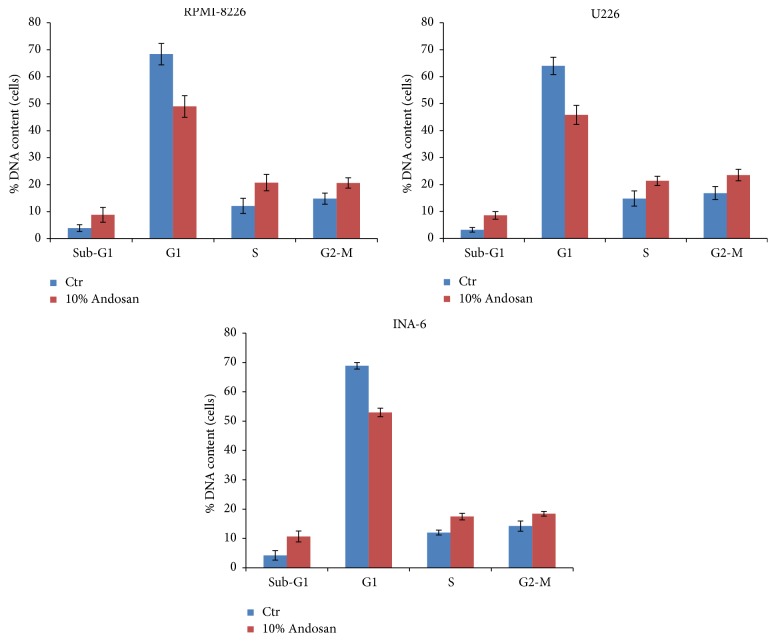
Figure 1.
Cell cycle analysis. The figure shows the percentage of cells cultured with either Andosan 10% or PBS (controls) in different cell cycle phases (sub-G1 phase, G1 phase, S-phase, and G2 phase). The percentage of cells was higher in the sub-G1 phase (p < 0.002) and lower in the G1 phase (p < 0.001) in cells cultured with Andosan 10% compared to controls (paired t-test), which is suggestive of cell cycle arrest in these cells.

