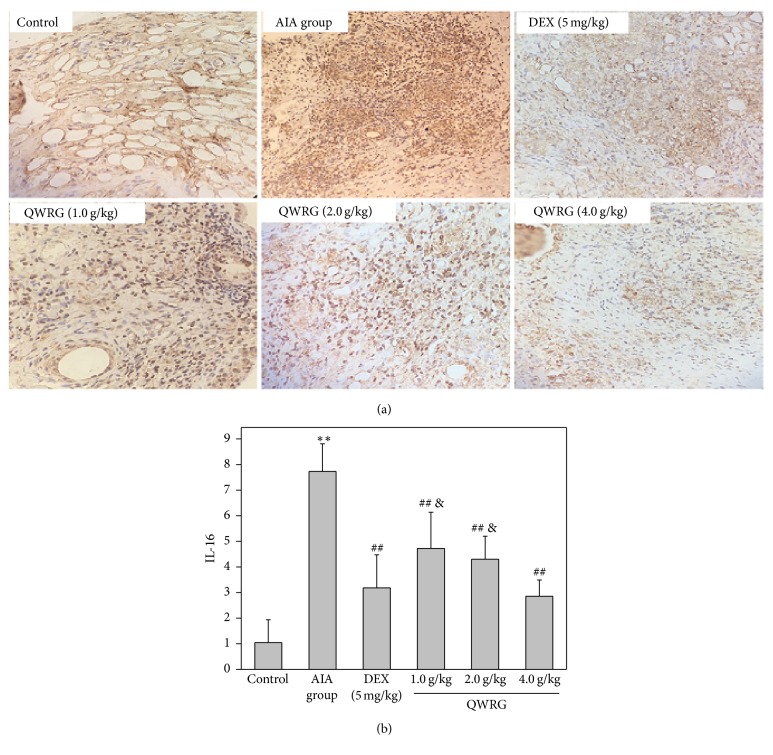
Figure 6.
Immunohistochemical results of IL-16 in synovium (immunohistochemistry of IL-16 in the knee joints taken from control rats, AIA model rats, QWRG-treated rats of 1.0 g/kg, 2.0 g/kg, and 4.0 g/kg, and DEX-treated group. Magnification ×200. Tissues from three different rats in each group and 10 randomly selected areas from each slide were analyzed. Quantitative data (mean ± SD) (n = 10) are presented using the average density values of the IL-16 positive regions. ∗∗P < 0.01 versus control; ##P < 0.01 versus AIA group; &P < 0.05 versus DEX).

