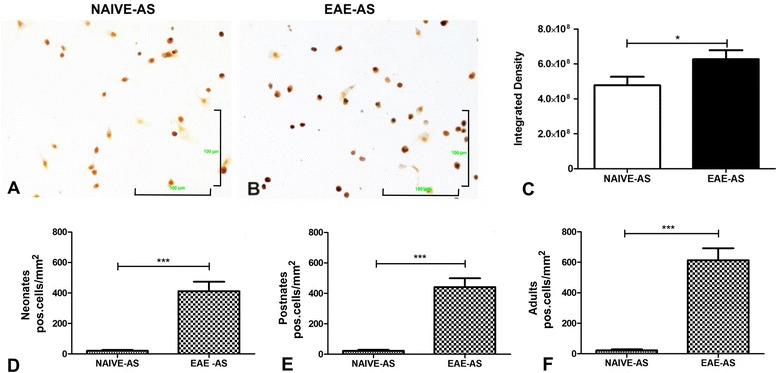
Fig. 2.

Antisera cross-reactivity to NPCs and increased selective binding to SVZ. a NAIVE-AS and b EAE-AS binding (DAB-brown staining) on dissociated neurospheres. Magnification=×40, Scale=100 μm. c Graphs demonstrate the integrated density of positive cells. d–f Bars represent DAB positive cells/mm2 in SVZ and periventricular area from three different developmental stages of normal mouse brain stained with NAIVE-AS and EAE-AS. Error bars indicate SEM (* p < 0.05, *** p < 0.001)
