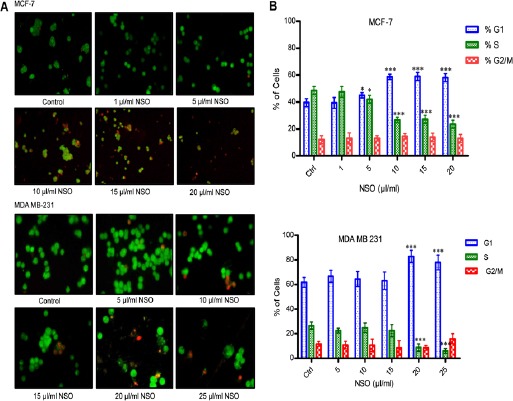
Figure 2.

Cell Cycle and Nuclear Morphological Analysis. (A) Nuclear morphological analysis using Nikon eclipsed fluorescence microscope. All pictures are typical of three independent experiments each performed under identical condition. (B) Analysis of cell cycle using Fluorescence Activated Cell Sorter (FACS). Data shown are the mean ± SD of one of the three similar experiments each performed in triplicate. * p < 0.05; ** p < 0.01; *** p < 0.001.
