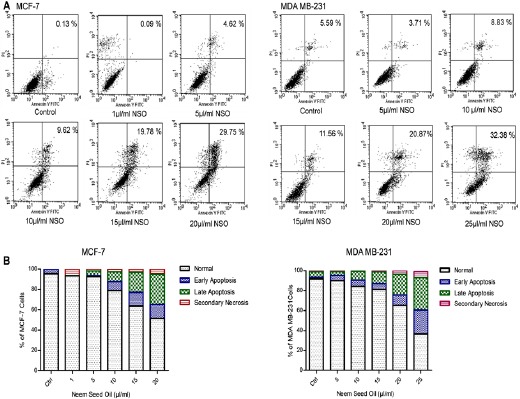
Figure 3.

NSO Induces Apoptosis in MCF-7 and MDA MB-231 HBCCs. (A) Analysis of apoptosis using Annexin V/PI staining. Briefly, after 48 h of treatment with NSO, cells were stained with Annexin V/PI and analyzed through flow cytometer. (B) Comparative graphical representation of flow data. Data shown are one of the three similar experiments each performed under identical condition.
