
Figure 1.
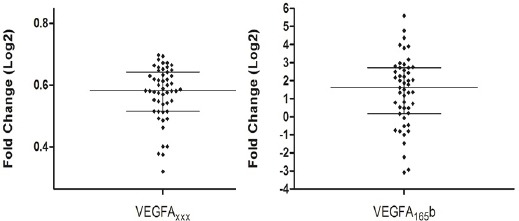
VEGFAxxx and VEGFA165b Expression in HNSCC as Compared to Non-Tumor Tissues. Fold change were Log2 transformed (y-axis). VEGFAxxx and VEGFA165b were overexpressed in tumors (Wilcoxon Signed Rank Test: p < 0.0001). The bars represent median with interquartile variation (25th percentile and 75th percentile). Calibrator (non-tumor tissues) log RQ = 0.