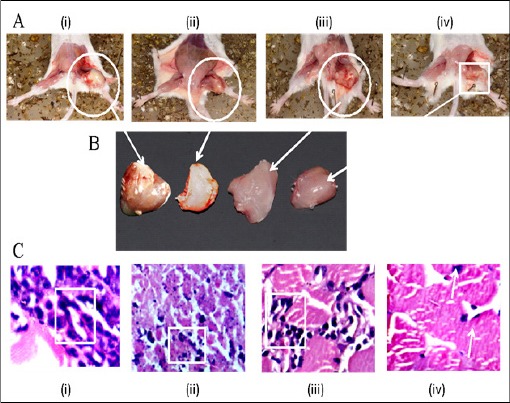
Figure 11.

Effect of PLL Treatment on Solid Sarcoma-180 Tumor: panel (A), subpanel (i) sarcoma-180 control (ii) 5-FU drug treated (iii) 20 mg/kg b.w PLL treated and (iv) 40 mg/kg b.w PLL treated. Panel (B) shows the dissected tumor tissues in the same order as in (A) above, marked by arrows and circles. Panel (C) H &E stained histological section of the solid tumour in the order as in panel (A) above, (i) control (ii) 5-FU (iii) 20 mg/kg b.w (iv) 40 mg/kgb.w, the cellular features are marked by boxes.
