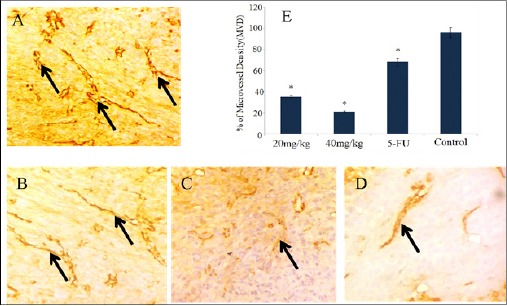
Figure 13.

Immunostaining and Optical Density of CD31 Expression in Swiss Albino Mice. (Magnification: 400X). (A) Control (sarcoma-180) (B) 5-FU (C) 20 mg/kg b.w (D) 40 mg/kg b.w, exhibiting the reduction of neovascularization (arrow marked) in the order as shown. Each bar represents the mean ±SD (n=3 tumors). *p<0.05 as compared to control group.
