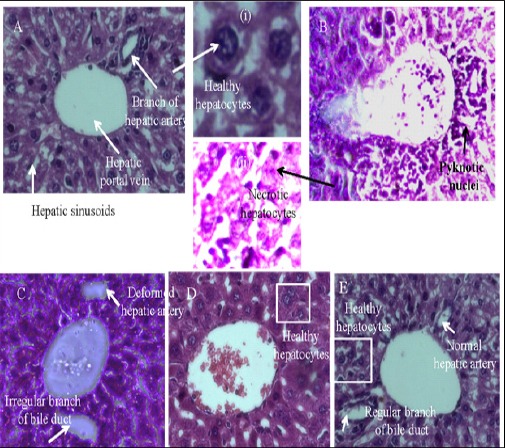
Figure 3.

H and E Section of Liver from Mice Showing Hepatocellular Profile of (20 mg/kg b.w) Group (Figure 3, panel D), showed cellular infiltration, congestion and mild central vein dilation. PLL (40 mg/kg b.w) treated group (Figure 3, panel E) showed moderate/less neoplastic focal lesions, almost normal hepatocellular architecture (Figure 3, panel A, subpanel (i), marked by arrow) has been observed suggesting less hepatotoxicity. Whereas in EAC control mice (Figure 3, panel B), reveals extensive hepatocellular lesions, as shown in subpanel (ii), as pyknotic nuclei (marked by arrow), exhibiting necrotic hepatocytes.
