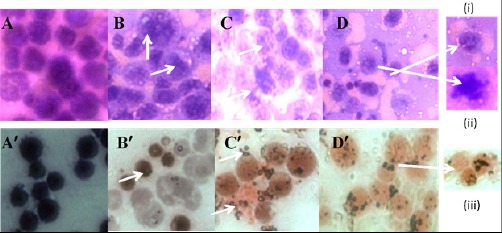
Figure 4.

Change in Morphology of theEAC Cells by H and E Stain (A) control (B) standard (5-FU) (C) PLL, 20 mg/kg b.w (D) PLL, 40 mg/kg b.w and by Papanicolaou staining (A)’control (B)’ standard (5-FU) (C)’ PLL, 20 mg/kg b.w (D)’ PLL, 40 mg/kg b.w. Panel (i) and (ii) of Figure 4 (D) show cellular blebbing and apoptotic body respectively and panel (iii) of Figure 4(D)’ show nuclear fragmentation.
