Figure 7.

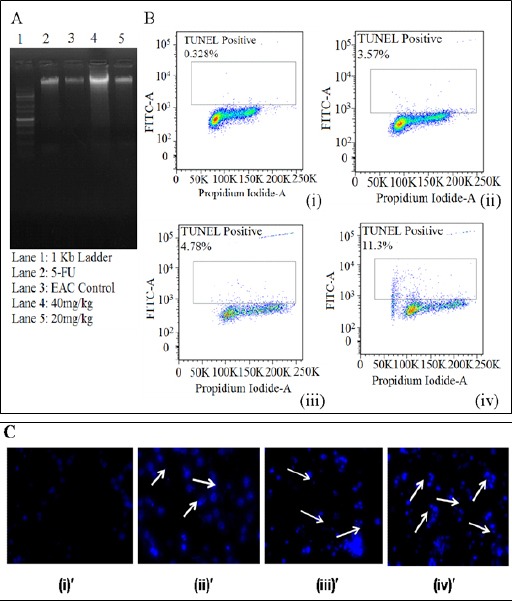
(A) DNA Fragmentation assay showing the corresponding descriptions in the Lanes, Exhibiting the Maximum Effect Corresponding to the PLL Dose 40 mg/kg b.w (B) TUNEL assay exhibiting apoptotic cell death for (i) control EAC cells (ii) standard drug (5-FU) (iii) PLL dose 20 mg/kg b.w (iv) PLL dose 40 mg/kg (C) DAPI staining showing (i)’ control EAC cells (ii) ’ standard drug (5-FU) (iii)’ PLL dose 20 mg/kg b.w (iv)’ PLL dose 40 mg/kg b.w, exhibiting the maximum apoptosis corresponding to the PLL dose 40 mg/kg b.w.
