Figure 8.

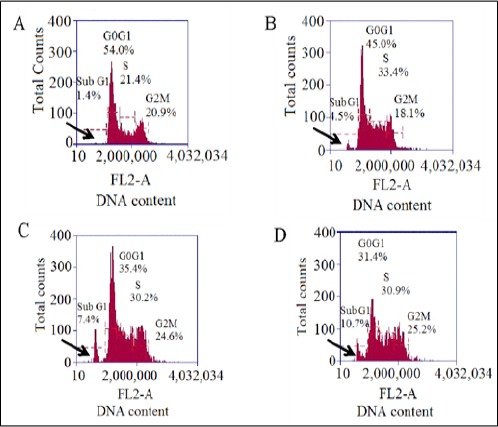
Cell Cycle Analysis by Flow Cytometry Showing A.) EAC control B.) Standard (5-FU) C.) 20 mg/kg b.w D.) 40 mg/kg b.w, the variation in the DNA content corresponding to the sub G1 phase (apoptotic phase), marked by arrow.

Cell Cycle Analysis by Flow Cytometry Showing A.) EAC control B.) Standard (5-FU) C.) 20 mg/kg b.w D.) 40 mg/kg b.w, the variation in the DNA content corresponding to the sub G1 phase (apoptotic phase), marked by arrow.