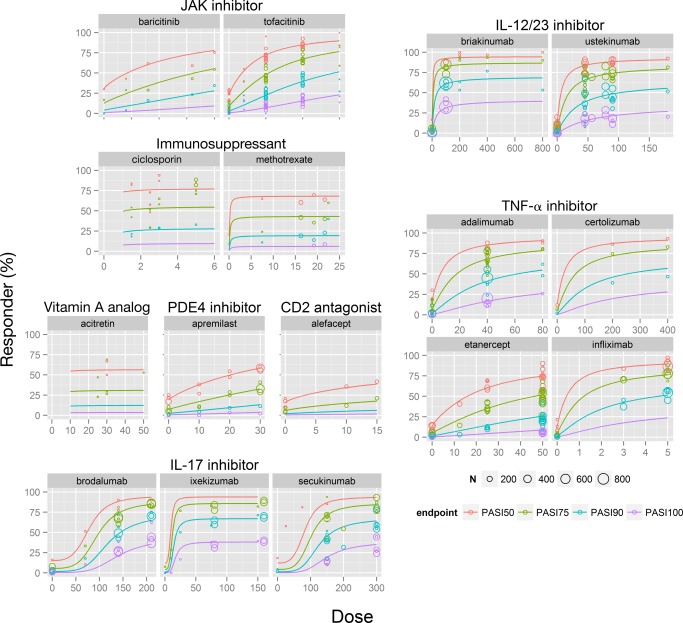
Figure 3.

Landmark analysis of dose–response at 12 weeks in patients with moderate to severe psoriasis. Solid lines: model‐predicted PASI endpoint data at 12 weeks (not placebo‐adjusted). The PASI responses at dose = 0 represent the placebo arm in each study. Circles represent observed data, with size proportional to the N of patients in the study arm. CD2, T lymphocyte; IL, interleukin; JAK, Janus kinase; PASI50/75/90/100, ≥ 50%, ≥ 75%, ≥ 90%, or 100% reduction from baseline Psoriasis Area and Severity Index score; PDE4, phosphodiesterase 4; TNF, tumor necrosis factor. [Color figure can be viewed at cpt-journal.com]
