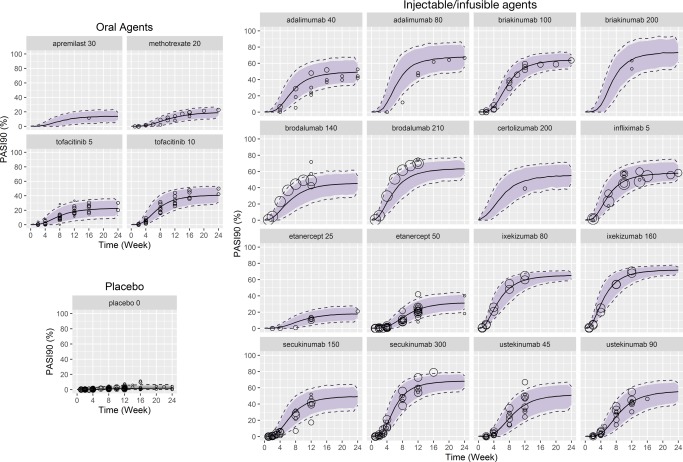
Figure 5.

External validation of predicted PASI90 response over time. PASI90 time‐course response was predicted using the final longitudinal model (developed for PASI75) by incorporating parameter estimates (scaling factors between PASI75 and PASI90) from the landmark model on the placebo and drug term. Solid line: predicted PASI90 response; gray shaded area: 90% confidence intervals; dotted lines: 95% confidence intervals; open circles: reported PASI90 response. Doses are in mg, with the exception of infliximab (mg/kg). PASI75/90, ≥ 75% or ≥ 90% reduction from baseline Psoriasis Area and Severity Index score. [Color figure can be viewed at cpt-journal.com]
